HANNA CHOBALYOUCONTROL · CASE STUDYBACK TO WORK ↗

YOUCONTROL · PRODUCT / UX DESIGN · APRIL–JUNE 2021

MARKET
ANALYSIS.

Turning complex business data into clear, actionable insights

A data-heavy B2B product that transformed complex company records into a self-service experience for lead generation and market research.

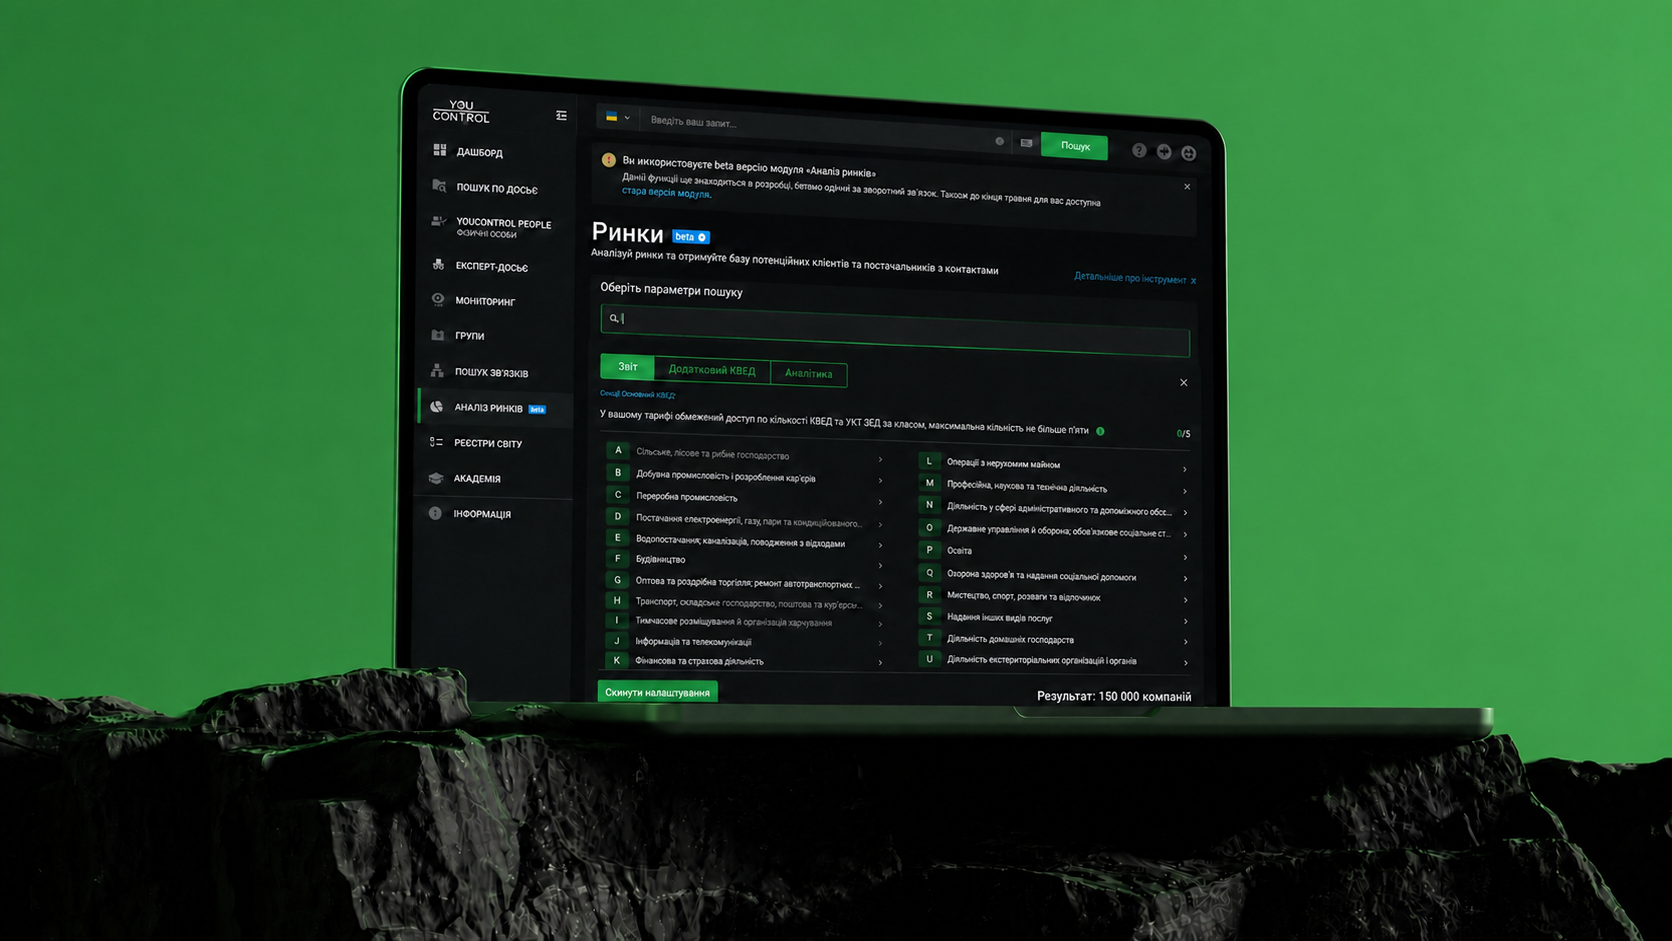
YouControl Market Analysis interface displayed on a laptop

S · SITUATION

FROM MANUAL REQUESTS TO A PRODUCT

YouControl customers repeatedly requested targeted company lists by industry (KVED), including contact information for B2B outreach.

Initially, developers manually queried and parsed the database for each request. As the same need kept recurring across different customers, the company saw an opportunity to turn this manual service into a scalable self-service product.

T · TASK

COMPLEXITY IN. CLARITY OUT.

My responsibility was to translate a highly complex data structure into an experience accessible to non-technical business users.

Make complex filtering manageable.

Users had to navigate numerous criteria, including the deeply nested KVED industry classification, without getting lost in the underlying data structure.

Make insights immediately visible.

Once a market was defined, thousands of company records had to become an interface where users could recognize meaningful patterns at a glance.

How might we help users navigate complex market data and turn thousands of records into insights they can understand in seconds?

PRODUCT TRANSFORMATION

Manual requests Repeated demand Self-service product

A · ACTION · 01

MAKING COMPLEX SEGMENTATION MANAGEABLE

One of the hardest UX challenges was KVED — a multi-level industry classification with a large number of categories and subcategories.

I explored different interaction models for navigating this hierarchy and designed a filtering experience that helped users progressively narrow the dataset without exposing its full complexity at once.

The system also had to accommodate different search behaviors: users who knew exactly what they were looking for and users who needed to explore the classification to define their market.

Complex hierarchy → Progressive filtering → Precise market segment

SCREEN 01 · KVED FILTERING · IMAGE PLACEHOLDER

A · ACTION · 02

DESIGNING FOR INSIGHTS, NOT DASHBOARDS

Filtering was only half of the problem.

The result could contain thousands of companies and large amounts of financial and business data. Simply displaying that information would shift the analytical work back to the user.

I structured the dashboard and selected visualizations around the questions users needed to answer quickly:

  • Who are the key players?
  • How concentrated is the market?
  • Where are companies located?
  • How are they distributed by size and financial performance?

The goal wasn’t to show more data.

It was to make patterns impossible to miss.

SCREEN 02 · MARKET INSIGHTS · IMAGE PLACEHOLDER

A · ACTION · 03

CONNECTING INSIGHTS TO THE UNDERLYING DATA

Aggregated analytics remained connected to individual companies.

Users could move from a high-level market pattern to the businesses behind it, explore company information and contacts, and build targeted lists for further action.

This connected two complementary product needs:

Audience discoveryWho should I target?
Market intelligenceWhat does this market look like?

Filter → Understand → Explore → Act

SCREEN 03 · COMPANY RECORDS · IMAGE PLACEHOLDER

R · RESULT

FROM MANUAL EXTRACTION TO A LASTING PRODUCT

Market Analysis launched in June 2021, transforming complex company data into a self-service experience for B2B prospecting and market research.

It reduced dependency on manual database requests and allowed users to independently define markets, discover relevant companies and identify patterns within large datasets.

AN UNEXPECTED INSIGHT

THE PATTERN BECAME VISIBLE

While testing the dashboard on real market data, we noticed a notable concentration of related companies within one energy-sector segment.

What would have been difficult to spot across thousands of individual company records became immediately visible through aggregated market views.

The observation was shared with journalists for independent investigation — demonstrating an unexpected use case for the product beyond its original B2B audience.

LONG-TERM VALIDATION

A CONCEPT THAT PROVED DURABLE

I wasn’t involved in the product’s long-term development after its initial launch, but the concept proved durable.

The functionality continued to evolve and later became part of YC.Market, YouControl’s standalone market intelligence product. Five years later, the product remains part of YouControl’s offering.

Similar company discovery, segmentation and market intelligence capabilities have also become established patterns across competing Ukrainian business-data platforms.

Manual data → Self-service discovery → Market intelligence
MY ROLE

PRODUCT / UX DESIGNER.

Information Architecture · Complex Filtering · Data Visualization · Interaction Design · UI Design · Prototyping

April–June 2021